The first version of this lab was a few hours of work. Then I got accepted, and suddenly I had no reason to keep building it, so I didn’t. I shouldn’t have stopped, but the break gave me time to learn and research a lot more.
When I finally came back and looked at what I’d built since the first post, it was a bit of a mess. The site worked and Suricata was detecting, but that was it. I’d tried to set up Wazuh and ELK at the same time, so there was half-finished infrastructure for both. Most of the software and operating systems were outdated, and OPNsense was still on the old firewall rule system, several versions behind.
At some point I just thought: this would be easier to start from scratch. So apart from Elasticsearch, I did. And while I was at it, I wanted to improve the design itself: a VPS tunnel instead of exposing my home connection, and a lot more segmentation.
The new layout
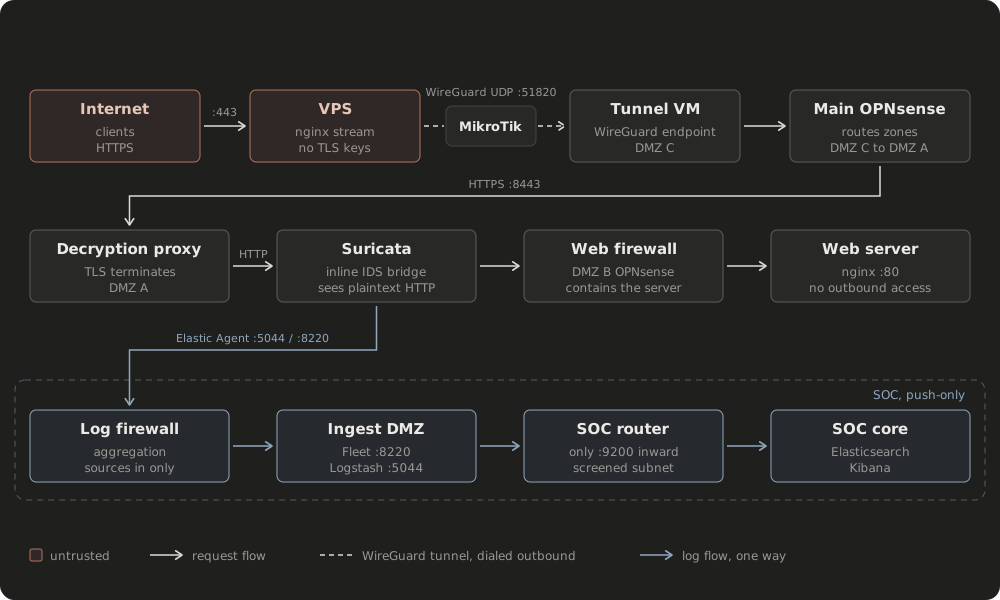
A request to this site now goes:
Client
  → VPS (nginx stream, no certificates)
  → WireGuard tunnel (dialed outbound from my side)
  → Tunnel VM          tunnel DMZ
  → Main OPNsense
  → Decryption proxy   decryption DMZ   ← TLS ends here
  → Suricata inline bridge              ← sees plain HTTP
  → Webserver OPNsense
  → Web server         webserver DMZ
Everything runs on Proxmox, with a MikroTik at the edge.
Getting traffic in: the VPS tunnel
Honestly, there wasn’t anything wrong with the old way. My ISP changes my IP every now and then, and I’d handled that with DDNS on the MikroTik. But then I got a new MikroTik, the configs didn’t come with it, and the scripts were a bit wack anyway.
(Side note: the first MikroTik I had was second-hand. The chance of someone having tampered with it was tiny, but knowing it was possible made me a little anxious the whole time I used it.)
The bigger reason was that I don’t really want my public IP exposed directly. People can be a bit goofy with it. The VPS design is just cleaner: the VPS has the public IP, and my home connection has zero open ports. A VM in its own DMZ dials out to the VPS over WireGuard and keeps the tunnel open, so it doesn’t matter when my home IP changes. My router only lets one thing out of the server network: UDP 51820 to the VPS.
The VPS itself only runs an nginx stream block that forwards raw TCP:
stream {
    server {
        listen 443;
        proxy_pass 10.99.0.2:8443;
        proxy_protocol on;
    }
}
There are no certificates on it. It never sees anything decrypted, so even if someone got into it, they’d get encrypted traffic and a tunnel endpoint. As a bonus, scans and floods hit the VPS’s connection instead of my home line.
One detail that took some care was keeping the visitor’s real IP through all the hops. The VPS adds a PROXY protocol header, the tunnel VM passes it on, and the decryption proxy turns it into X-Forwarded-For for the web server. Each hop only trusts that header from the one host in front of it, so nobody can fake it.
Where TLS ends
The decryption proxy is the only machine with a private key. It gets a Let’s Encrypt wildcard certificate through Cloudflare’s DNS challenge, so nothing ever needs to reach it from outside for renewals. The DNS record is set to DNS-only (grey cloud) on purpose. With Cloudflare’s proxy turned on, they’d decrypt everything at their edge, which kind of defeats the point.
The proxy has one leg facing the tunnel side and one facing the web server. It doesn’t route anything between them. It ends the incoming connection and opens a brand new one to the web server, always from the same address, which is what the firewalls further in match on.
Letting Suricata see
The hop from the proxy to the web server is plain HTTP, and that’s deliberate. It’s what lets Suricata, sitting inline on that link, see the actual requests: URLs, headers, everything. If I re-encrypted it, Suricata would only see encrypted traffic and be mostly useless.
Within hours of the site going live, bots were already throwing this year’s CVEs at it: Vite file reads, Langflow remote code execution, requests for .env files. None of those apps exist on a static site, so every one of them just gets a 404, but Suricata flags them all.
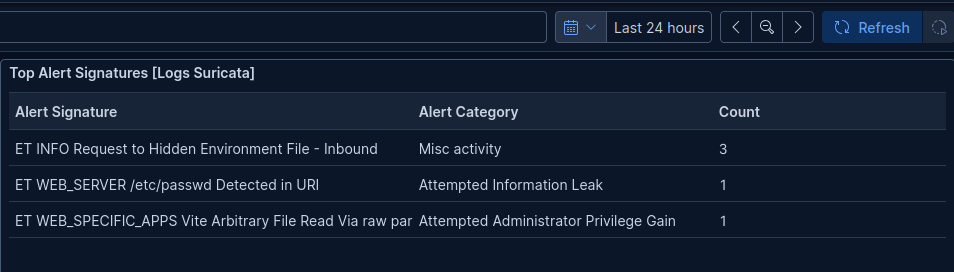
The alerts dashboard right after fixing the SOC (more on that below). These counts are from my own test requests. The bots’ earlier attempts are stuck in an old index that the dashboard can’t read.
The web server can’t go anywhere
The web server accepts exactly one thing: HTTP from the decryption proxy. It can’t start any connections at all. No internet, no DNS, nothing back toward the proxy.
Even putting new content on it doesn’t open a network path. I attach a disk to it in Proxmox, copy the files, and detach it. All management goes through the Proxmox console, so none of the DMZ hosts accept management connections over the network.
The checksum
This is the one that strained my mind the most.
The servers had been running fine for months. Then I restarted them, and curl from the decryption proxy to the web server just… hung. Everything is blocked by default, so the firewall logs were the first thing I checked. The request from the proxy was allowed, and I could see it leaving the firewall toward the web server. So why was nothing coming back?
I added a ping rule. Ping worked fine. Okay. With all the sense I had at the time, it should work. Why is it not working?
I didn’t even have tcpdump on the web server, and it had no internet, so I couldn’t just install it. So I checked routes. Double-checked things. Checked the firewall log again, about four times, getting kinda pissed at this point. Then I looked at the states on the firewall and saw SYN_SENT:CLOSED. What? Okay, something is very fishy now.
I checked logs and counters on the web server, which helped rule things out but didn’t point at anything. It felt like some of my tools were straight up lying to me. I asked AI for help, and together we still couldn’t figure it out for a good while. I put an allow-all rule between the proxy and the web server. Nothing. At that point I kinda lost it and built a whole new web server. Surely a fresh install works… nope.
Then I blamed Suricata and updated both Suricata and its host to the newest versions. It’s just copying packets from one interface to the other, so it really shouldn’t have been the problem, but I was running out of ideas.
Many, many hours had passed by now. I took a lot of breaks, and yeah, procrastinated too, which is honestly part of why it took almost two days. Life was stressful at the time as well, so this was not very fun. But stress is good, as long as it isn’t chronic.
The next day, on the new VM, I finally had tcpdump. Traffic coming in, nothing leaving. Only SYN packets. No SYN-ACK, but no RST either, even though I’d checked multiple times that the port was listening. And then I finally noticed it: cksum incorrect on the incoming SYN. Which, to be honest, I should have noticed way earlier. I just wasn’t running tcpdump verbose enough to see it.
What was actually going on
The decryption proxy’s network card had checksum offloading turned on. That means Linux hands the packet off without a finished checksum, expecting the network hardware to fill it in. In a VM there’s no real hardware doing that, and when those packets crossed a routed hop between VMs, they arrived at the web server with the checksum still unfinished. The web server’s kernel checked it, saw garbage, and dropped the packet. Silently. That’s why there was no SYN-ACK and no RST.
It also explains the ping: ICMP checksums are always calculated in software, so ping never had the problem.
And the tools “lying” was partly real. tcpdump grabs packets before the kernel decides what to do with them, so seeing the SYN arrive didn’t mean the kernel accepted it. On the sending side it’s even worse: it captures before the checksum gets filled in, so outgoing packets always look broken when offloading is on. That’s part of why I didn’t trust what I was seeing.
The part that got me: I’d already checked offloading on the web server. Wrong end. The broken checksums were coming from the proxy, and I had no hunch it could be the proxy, because it had worked perfectly fine for months. I still don’t know exactly what changed. My best guess is that after months of uptime, the restart brought in a pile of updates at once, and one of them changed how offloading behaves between the VMs.
The fix, on the proxy:
ethtool -K ens19 tx off tso off gso off
And boom. The glorious “Welcome to nginx!” default page. I just sat there and stared at it for a bit. Damn. One line with ethtool.
What I’m keeping from this: always run tcpdump with -vv, and check the kernel’s own counters (nstat -az shows an InCsumErrors counter for exactly this). And offloading is now the first thing I turn off on every new VM.
A few smaller ones
After that, the other bugs felt easy.
The tunnel VM couldn’t reach the proxy: SYNs arriving, no reply. ip route get on the proxy showed the reply leaving through the web server side interface, because of a default route left over from the old design. Removing it fixed it.
Then the WireGuard handshake wouldn’t come up, even though OPNsense was passing the traffic. A packet capture on the MikroTik showed the packets leaving with their private source address. The new tunnel DMZ just didn’t have an outbound NAT rule yet. One rule later, handshake.
The last one was in the SOC. Suricata’s fast.log was full of alerts, but the alerts dashboard in Kibana was completely empty. The alerts were actually in Elasticsearch the whole time. Suricata’s stats events carry hundreds of counter fields, and they had used up the index’s 1000-field limit before the alert fields ever got mapped. Elasticsearch doesn’t reject anything when that happens, it just quietly stops indexing the new fields. So the alerts were stored, but nothing could search them. Raising the limit and rolling over to a fresh index fixed it. Same pattern as the checksum: everything looked fine, the data was right there, and it still didn’t work.
Bringing the SOC back
When I opened Kibana again after months, it was showing around 100 errors a day, all from agents that didn’t exist anymore, plus a pile of data from the old setup back when I was a bigger noob. So this got rebuilt too.
Logs now go through two firewalls:
Suricata sensor
  → Aggregation firewall        faces the log sources
  → Ingest DMZ: Fleet Server, Logstash
  → SOC router                  protects the core
  → Core: Elasticsearch, Kibana
The ingest DMZ is where logs from possibly compromised hosts get parsed, so it sits between two firewalls on its own. The rules are simple: sources can send logs in, and nothing in the SOC can ever connect back out to them. The aggregation firewall doesn’t even have a route to the core. And Kibana never talks to Fleet directly: they only meet through Elasticsearch.
One thing I found while rebuilding: the old Logstash user could delete indices and rewrite ingest pipelines. Past me gave it way too much. Now it can only add events, so even a compromised Logstash can’t delete or change what’s already stored.
Four DMZs
If I’m proud of one thing, it’s the end result. I never thought I’d end up with four DMZs: one for the tunnel, one for the decryption proxy, one for the web server, and one for log ingest. It wasn’t the plan. It just kept happening, because every time I asked “okay, if this box gets owned, what can it reach?”, the answer was “too much”, and the fix was another zone.
What’s next
What I actually want to do next is attack it. An internal pentest: drop a C2 implant on each host and see what that traffic looks like, and what the SOC catches.
Everything is firewalled pretty tightly, so honestly I don’t even fully know how to go about it yet. But that’s kind of the point. If a beacon on the web server can’t get out, the blocked attempt should show up in the logs, and that’s worth testing on its own. And the interesting part will be the few narrow paths I did leave open, and whether something could sneak out through those.